
Reports
Daily fleet report.
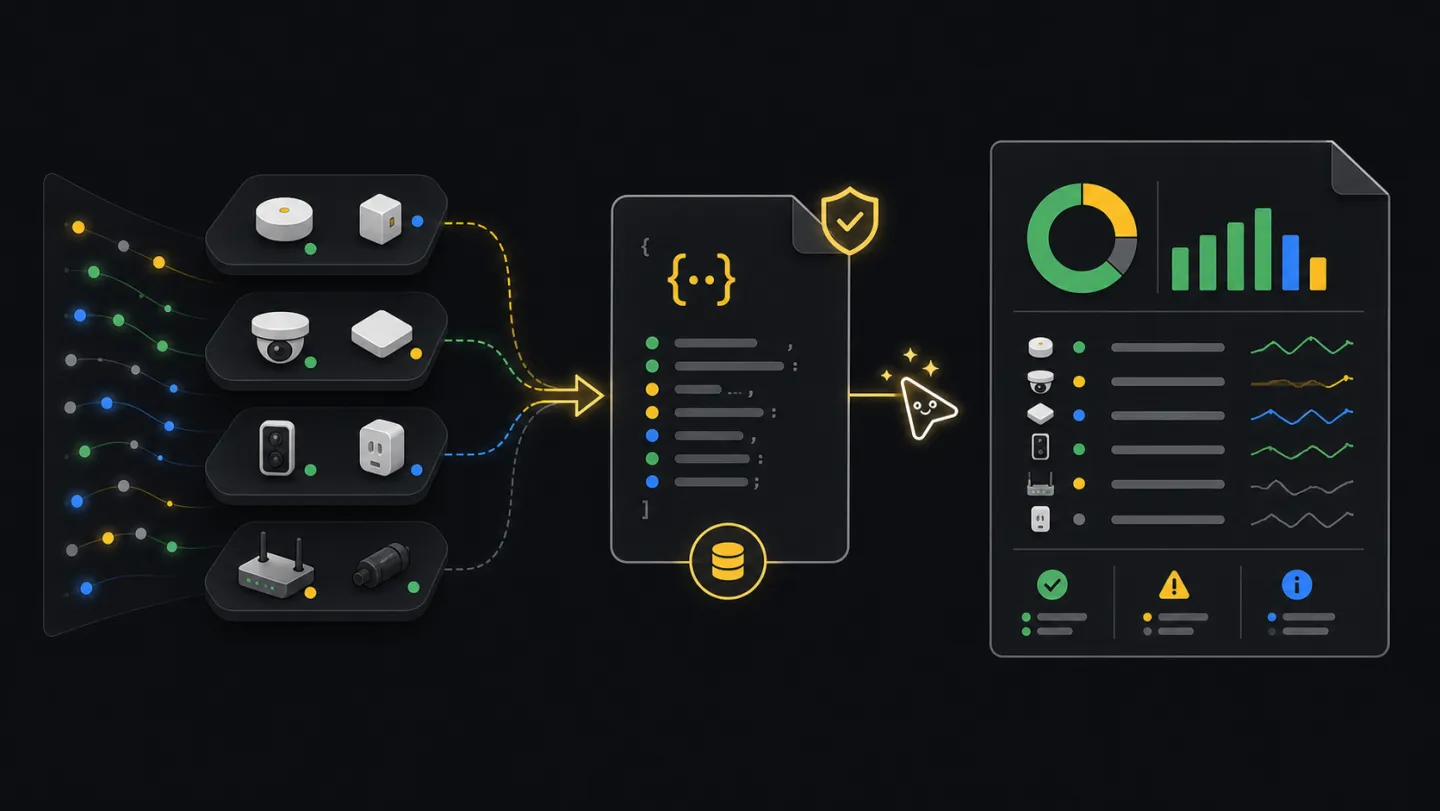
Use this workflow when a daily review, escalation, or customer update needs current fleet state, clear counts, and a report that can be regenerated from the same source data.
Before you start: You need a connected profile, so xyte-cli ops inspect deep-dive can read fleet state. Run Setup readiness first. New here? See the glossary.
Ask an agent
Ask for the report you need to send. The agent will save the source JSON first, render the report from that file, and return the paths.
Make today's fleet report and show me the saved files.What the agent will do
- DiscoverCheck accessConfirm xyte-cli can read fleet state.
- InspectCreate sourceSave the deep-dive JSON before writing prose.
- ChoosePick formatUse Markdown unless PDF or another format is requested.
- WriteSave reportWrite the source JSON and readable report.
- ReturnShow pathsSummarize counts, report path, source path, and follow-up items.
Ask how it works first
Ask this when you want to understand which files matter before you schedule or share the report.
How do I create a daily fleet report with xyte-cli?
What files do I save from a fleet report?
How do I turn fleet JSON into a handoff?
Goal
Build the report from a saved JSON input, not from a separate manual summary. That keeps the handoff reproducible and gives an agent or script a source file to reuse.
Commands
Create the deep-dive source file
The
--windowvalue is in hours. Use 24 for daily review.xyte-cli ops inspect deep-dive \ --tenant <tenant-id> \ --provider-scope auto \ --window 24 \ --output json \ --out ./artifacts/xyte-deep-dive.daily.json \ --strict-jsonRender a Markdown report
Markdown is easy to review in a terminal, commit comment, or support note.
xyte-cli ops report generate \
  --tenant <tenant-id> \
  --input ./artifacts/xyte-deep-dive.daily.json \
  --out ./reports/xyte-daily.md \
  --render markdown
Render a PDF when you need an attachment
Use the same JSON input so the Markdown and PDF tell the same story.
xyte-cli ops report generate \
  --tenant <tenant-id> \
  --input ./artifacts/xyte-deep-dive.daily.json \
  --out ./reports/xyte-daily.pdf \
  --render pdf
Keep a compact fleet snapshot
This is useful for dashboards and quick trend checks.
xyte-cli ops inspect fleet \
  --tenant <tenant-id> \
  --provider-scope auto \
  --output json \
  --out ./artifacts/xyte-fleet.daily.json
What to look for
- Offline device count and offline rate.
- Active incidents and whether they cluster in one space, model, or partner.
- Open tickets that need follow-up.
- Churn in the selected window. If churn is noisy, rerun with a shorter window such as 12 hours.
# Handoff summary
Devices: 124
Offline devices: 7
Active incidents: 18
Open tickets: 3
Report: ./reports/xyte-daily.md
Use the report when the source JSON exists, the rendered report exists, and the headline numbers are clear enough for a status update. If the report came from the wrong source, the output folder is missing, or the window is too broad, fix that and rerun from the source step.
Make this repeatable
# Environment
XYTE_TENANT=<tenant-id>
REPORT_WINDOW_HOURS=24

# Rerun path
xyte-cli ops inspect deep-dive --tenant "$XYTE_TENANT" --window "$REPORT_WINDOW_HOURS" --output json --out ./artifacts/xyte-deep-dive.daily.json --strict-json
xyte-cli ops report generate --tenant "$XYTE_TENANT" --input ./artifacts/xyte-deep-dive.daily.json --out ./reports/xyte-daily.md --render markdown
If it fails
Confirm the input file came from xyte-cli ops inspect deep-dive, not xyte-cli ops inspect fleet.
Create ./artifacts and ./reports, then rerun the command.
Use a shorter --window and generate a new source JSON before rendering the report.